
A Simple Activity To Explain A Change in Demand vs A Change in Quantity Demanded

September 30, 2024
Jamie Wagner is a Professor and Teaching Fellow with the Foundation for Teaching Economics as well as an Associate Professor of Economics and Director of the Center for Economic Education, University of Nebraska at Omaha. In this series, Dr. Wagner will discuss best practices for teaching economic principles as well as current events and their economic implications.
One of my biggest hurdles as an instructor is helping students understand and graph the difference in a change in demand versus a change in quantity demanded. I know this sounds trivial but it’s not – there’s a major difference and it’s one the media often gets wrong.
Let’s take a quick look:
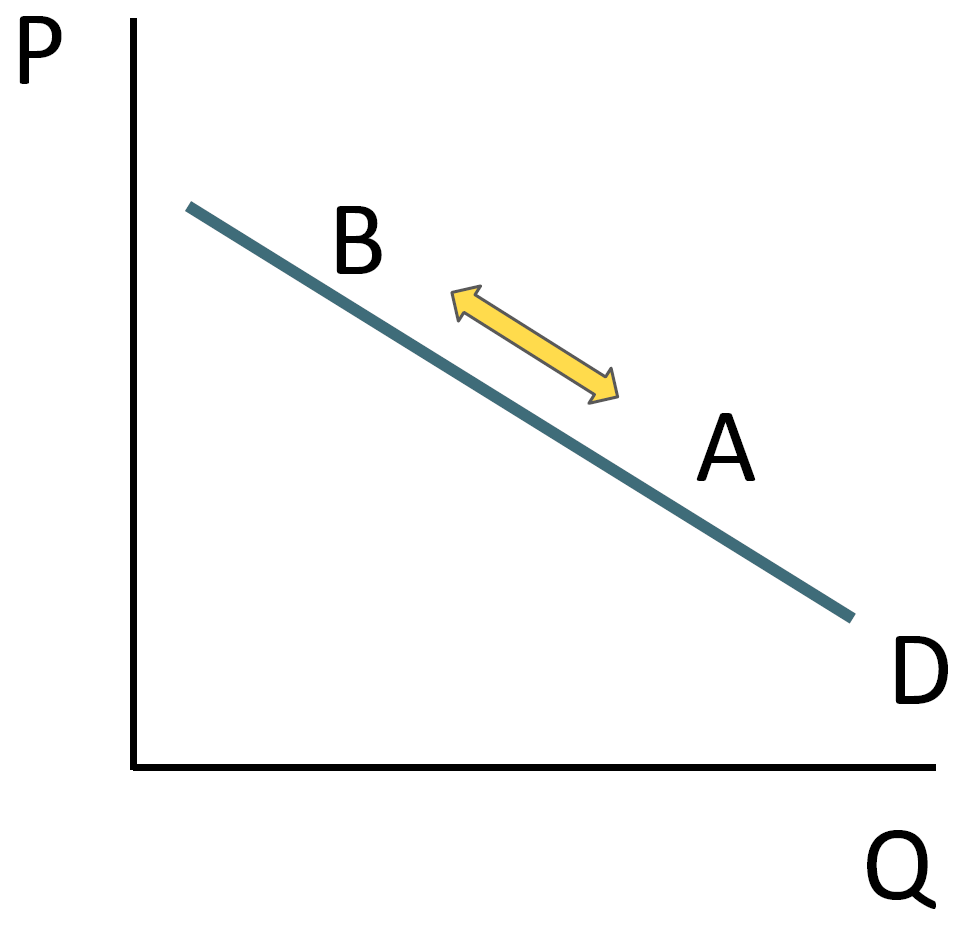
A change in quantity demanded is a change in the number of people who are trying to buy something, caused by a change in price. Graphically, this is shown as a movement along the curve – no new curve is created. The key is that the initial catalyst is the change in price – if price changes, a change in quantity demanded occurs due to the law of demand.
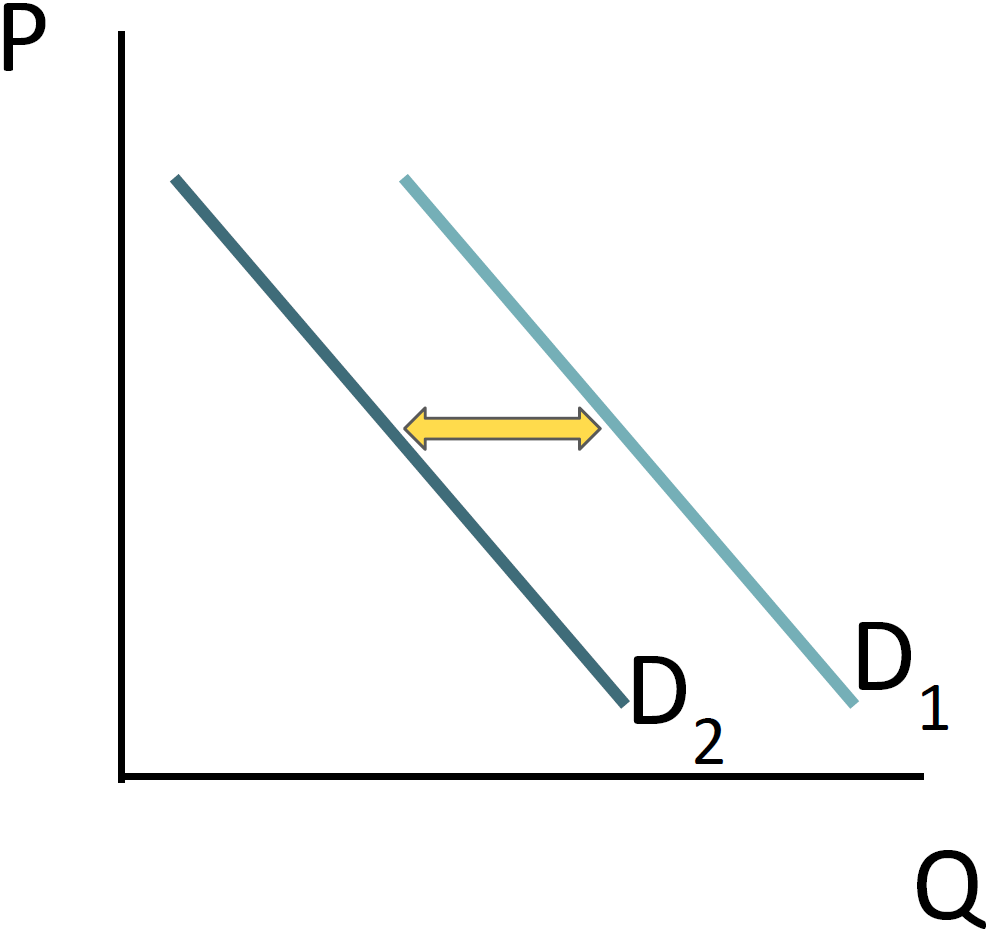
However, a change in demand is a change in the demand at all price points. This is caused by a change in a non-price determinant of demand– for example, a change in tastes or preferences; the price of a related good (which are known as complements and substitutes); income (normal and inferior goods); number of buyers; or future price expectations. Graphically, a whole new curve is created.
As students often struggle with this idea, I start with an auction, which is an easy classroom activity that helps illustrate the point.
First, I buy a beverage (Coke, Pepsi, Prime – any item of interest) and tell my students that it’s up for auction. Note – we use actual money and honor our contracts in my class. They must give me what they are willing to spend and I must give them the drink. So if students don’t have money or aren’t interested, they opt out of participation.
I start the bidding at $0.01 and ask anyone who is willing and able to buy the item to please stand. I tell them to look around at how many people are standing (typically a majority). Then, I raise the price to $0.25 – if they are unwilling to pay that price, they must sit down. I then continue to raise the price until only one person is standing. That person wins the item, and the transaction is completed. Throughout this process, students are asked to pay attention to how many people continue to stand as the price increases.
Next, I debrief and ask the students what they noticed. In so many words, they will end up describing the law of demand. As the price for the item increased, the quantity of buyers decreased. This is a great point to make and discuss throughout lessons on supply, demand, and the market. Demand for the item was not changed – only the price was adjusted.
I’ve found that the visual change in the number of people standing and sitting is a helpful way for students to understand the idea of demand. This activity is also a good reference point for students as they learn about the concept of supply and how these forces affect the overall market economy.

Empowering Educators: Michele Mar’s Journey with FTE
February 26, 2026 FTE’s commitment to excellence in economic education starts with its teachers – and each year, we have…

The True Cost of Glory: What Economics Teaches Us About the Winter Olympics
February 19, 2026 As Norway celebrates its 15th gold medal and Italy rallies behind its home team’s nine golds at…

Making Economics Meaningful for Students
December 19, 2025 The Fund for American Studies’ Liberty and Leadership podcast features FTE’s own Amanda Stiglbauer, a longtime member of our…