Activity 7: The Great Depression – A Family’s Choices

- >
- Teachers
- >
- Teacher Resources
- >
- Lesson Plans
- >
- Economic Forces In American History
- >
- Activity 7: The Great Depressi…
Lesson Overview:
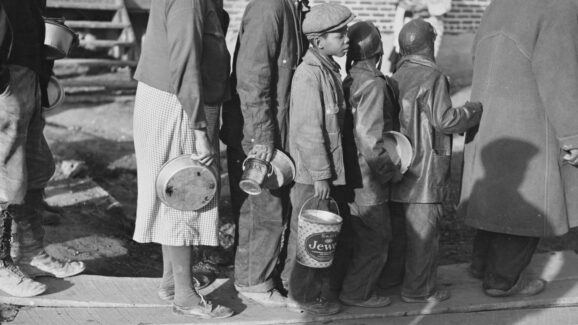
In this simulation, students play the role of families in a small town, trying to deal with the changes in income they experience a a result of the Great Depression.
Video Demonstration
Content Standards:
History Standards (from National Standards for History by the National Center for History in the Schools)
Era 7: The Great Depression and World War II (1929 – 1945)
Standard 1: The causes of the Great Depression and how it affected American society.
1B: The student understands how American life changed during the 1930s.
Therefore, the student is able to:
-
Analyze the impact of the Great Depression and the Dust Bowl on industry and workers and explain the response of local and state officials in combating the resulting economic and social crises.
-
Analyze the impact of the Great Depression on the American family and on ethnic and racial minorities.
Economics Standards (from Voluntary National Content Standards in Economics)
Standard 1: Productive resources are limited. Therefore, people cannot have all the goods and services they want; as a result, they must choose some things and give up others.
-
Choices made by individuals, firms, or government officials often have long-run unintended consequences that can partially or entirely offset the initial effects of their decisions.
Standard 14: Entrepreneurs are people who take the risks of organizing productive resources to make goods and services. Profit is an important incentive that leads entrepreneurs to accept the risks of business failure.
-
Entrepreneurial decisions affect job opportunities for other workers.
Standard 18: A nation’s overall levels of income, employment, and prices are determined by the interaction of spending and production decisions made by all households, firms, government agencies, and others in the economy.
-
One person’s spending is other people’s income. Consequently, an initial change in spending (consumption, investment, government, or net exports) usually results in a larger change in national levels of income, spending, and output.
-
When desired expenditures for consumption, investment, government spending, and net exports are less than the value of a nation’s output of final goods and services, GDP decreases and inflation and/or employment decreases.
Standard 19: Unemployment imposes costs on individuals and nations. . . .
-
Unemployment rates differ for people of different ages, races, and sexes. This reflects differences in work experience, education, training, and skills, as well as discrimination. Unemployment can be caused by people changing jobs by seasonal fluctuations in demand, by changes in the skills needed by employers, or by cyclical fluctuations in the level of national spending.
Activity Guide
Time:
2 – 3 class periods
Concepts:
Scarcity
Choice
Opportunity cost
Circular flow of income and expenditure
Unemployment
Materials:
- Overhead transparencies of Visuals #1-5
- Activity materials:
- 1-2 sets of individual role cards, pp. 15 -20 (laminated for future use)
- individual copies of Family Background handouts, pp. 9 -14 (laminate for future use)
- Note that there are 6 families, with 5 roles each. For classes larger than 30 students, create additional roles, additional families, or assign more than one group to each family
- Family Budget worksheets, pp. 21 – 26 – 1 per family (or 1 per student)
- Suggestion: Color-code the families’ materials:
- McFadden = green
- Taylor = pin
- Anderson = blue
- Johnson = yellow
- Jacinski = orange
- Svensgaard = purple or buff
- 1 sheet of butcher paper or poster board per group, wide point markers
- Suggestion: Color-code the families’ materials:
Procedures and Debriefing Teacher Guide
- Post on the overhead (transparency #1) and read the description of Butcherville, the town students will be “living” in during the activity.
- Divide the class into “family” discussion groups of 5 students each. Distribute family background handouts and give students time to read them.
- Alternate Option: For larger classes, to ensure that all students have an active role in the discussion, create double the number of discussion groups, assigning each of the family roles to 2 groups. If you don’t quite have multiples of 5, ask some students to play 2 roles in the “family.” (Doubling up on the children’s roles is easiest.)
- Post the activity directions (overhead transparency #2) and review them with students. Answer any questions.
- Distribute the individual role cards and Family Budget worksheets. Allow 20-25 minutes of work time.
- Teacher Note: You may want to distribute overhead markers and transparencies of the Family Budget worksheets to facilitate the ensuing reporting out and class discussion.
- Ask each family to appoint a spokesperson and allow each spokesperson several minutes to report family decisions.
- Discuss:
- What changes did your families make?
- Did your quality of life (or standard of living) change?
- Some families may actually answer, “No” to this question, choosing to use their savings to maintain their lifestyle. If no family does, point out that it would be an option – for however long the savings held out.
- Most families will answer, “Yes.” This is a good opportunity to review scarcity, choice, and cost. Point out that despite changing income circumstances, they still had choices: to change jobs, to spend savings, maybe even to move somewhere else. Some were unwilling to make those choices because it meant giving up other benefits – like living in Butcherville. Choice and opportunity cost still exist, even in the face of greater scarcity.
- Which changes were greater – changes in income or changes in expenditures?
- Over which did you feel you had more control – income or expenditure? Why?
- Most students will feel that they had more control over expenditures. Use directed questions to help them understand that while all employment in the town may be affected by conditions in the larger economy, their individual incomes are also the long-term result of earlier personal decisions (whether to go to medical school, for example) rather than that they “didn’t have any choice” about their employment situation.
- If your families are representative, what has happened to the overall level of income in Butcherville? the overall level of expenditure?
- Distribute large pieces of butcher paper or newsprint and several large point markers to the family groups. Display Visual #3 (The Ripple Effect) and go over the directions with the students.
- Allow family groups 15-20 minutes to work on their ripple diagrams. Instruct groups to post their charts on the wall when finished.
- Convene a class discussion, allowing each group to share what it believes to be both the immediate and the far-reaching effects of its personal decisions about income and consumption.
- Discuss:
- How did one family’s decision to reduce consumption affect others in Butcherville? It reduced the income of others – and therefore affected their ability to consume.
- Suggest a generalization that describes the relationship between income and expenditure among the members of an economy. One person’s expenditure is someone else’s income. (See benchmark for Standard 18: “One person’s spending is other people’s income. Consequently, an initial change in spending (consumption, investment, government, or net exports) usually results in a larger change in national levels of income, spending, and output.”)
- Suppose that families in Butcherville choose to use their savings rather than reduce consumption. Does that mean that no one’s income will be affected? It is important to help students see that reductions in savings will also have income effects, although the impact may not be quite so immediate as cutbacks in expenditures. As savings falls, so does investment, resulting in less job creation, etc.
- Display overhead transparency #5.
- Predict: If the pattern of reduced consumption and spending of savings continues, what will happen to the economy of Butcherville? Include in your prediction: unemployment rates, business failure rates, levels of personal consumption, new business start-up, population growth, etc.
- Students should predict a continuing decline or contraction of the economy of Butcherville. Unemployment and business failure will both climb; there will be little investment and no inclination to risk starting new businesses. People may leave the city looking for better jobs elsewhere.
- Are the families of Butcherville acting in their best interests when they choose to cut back consumption in the face of reduced income?
- Yes
- Will their rational decision to cut back produce the result – a return to economic health – that they desire? In the short run? In the long run?
- Help students to see the problem of unintended consequences (See benchmark for Standard 1: “Choices made by individuals, firms, or government officials often have long-run unintended consequences that can partially or entirely offset the initial effects of their decisions.”) A family’s decision to cut back on consumption has the desired short term effect of helping them to live within their means and not get into financial difficulty. However, if many of the Butcherville families do the same, the reduction in spending will reduce incomes throughout the community as businesses cut back or even fail, further reducing employment. In an indirect, and seemingly perverse way, then, the families’ attempts to make responsible financial decisions may eventually cause their own loss of employment.
- Transfer to the Great Depression: What was the impact on the economy of the United States of many individual families cutting back on consumption?
- Increasing cutbacks in production and business failure resulted in further reductions in employment, which further reduced incomes and expenditures, etc. Help students to see the downward spiraling of income and employment that characterized the Great Depression.
- Predict: If the pattern of reduced consumption and spending of savings continues, what will happen to the economy of Butcherville? Include in your prediction: unemployment rates, business failure rates, levels of personal consumption, new business start-up, population growth, etc.
- Post the overhead transparency of the circular flow model of income and expenditure. (See overhead transparency #4)
- Review the model, using specific people and products from Butcherville – i.e. the Ramshead Textile factory, a business, buys Bill Anderson’s labor in the factor market; the McFadden household buys a private school education in the product market; etc.
- Direct students at their desks (either individually or in their family groups) to enter the family they discussed – as they were described at the beginning of the activity – on the handout diagram of the circular flow.
- Using arrows of different sizes or of increasing or decreasing size, show how the circular flow is affected by the changes your family experiences.
- Help students recognize that the experience of the Butcherville families is analogous to what happened in the Great Depression. Use this as a lead-in to:
- study and discussion of the causes of the Depression,
- the role of the Federal Reserve system,
- the efforts of the Hoover and Roosevelt administrations to deal with the human suffering, and
- the role of WWII in pulling the nation out of the Depression.

Tell Our Elected Officials to Enroll in FTE Programs, Please!
January 30, 2026 Despite last-minute negotiations late this week, President Trump and congressional leaders appear to once again be on…

Foundation for Teaching Economics Opens Student Application for Summer 2026
January 12, 2026 The Foundation for Teaching Economics is pleased to announce that applications for Summer 2026 student programs are…

Making Economics Meaningful for Students
December 19, 2025 The Fund for American Studies’ Liberty and Leadership podcast features FTE’s own Amanda Stiglbauer, a longtime member of our…
