Lesson 1: Our National Debt

- >
- Teachers
- >
- Teacher Resources
- >
- Lesson Plans
- >
- Making Sense of the Federal Budget, Debt & Deficits
- >
- Lesson 1: Our National Debt…
Lesson Overview
The national debt is growing by more than a trillion dollars per year. But the process by which the debt grows and the magnitude of that growth is abstract and elusive. This lesson introduces students to the national debt, the decision-makers, and the process by which debt is incurred. It also provides the historical context so students can make sense of the national debt scenario today. Through a fun Kahoot! competition, this lesson activity exposes what students think they know about the U.S. National Debt while debunking some common myths and misunderstandings. Whether used to introduce the lesson or teach concepts throughout the lesson, this game-show-style activity will keep all students engaged!
Key Terms & Economic Concepts
- Balanced Budget
- Budget Deficit
- Budget Surplus
- Discretionary spending
- Economic Growth
- Federal Budget
- Federal Debt
- Gross Domestic Product
- Interest
- Mandatory spending
- Opportunity Cost
- Taxes
- Treasury notes, bills, and bonds
Objectives
Students will be able to:
- Identify the major sources of revenue for the federal government.
- Describe how budget deficits and surpluses are related to the federal debt.
- Explain how the federal government borrows money.
- Describe historical trends in federal debt as a share of GDP.
Time Required
45 minutes
Materials
- Kahoot Game
- Optional: Lesson 1 Essential Understandings (if assigning as a student reading) – 1 copy per student
Voluntary National Content Standards in Economics
CONTENT STANDARD 1
Students will understand that productive resources are limited. Therefore, people cannot have all the goods and services they want; as a result, they must choose some things and give up others.
- Benchmark 1: Choices made by individuals, firms, or government officials often have long-run unintended consequences that can partially or entirely offset the initial effects of their decisions.
CONTENT STANDARD 16
Students will understand that there is an economic role for government to play in a market economy whenever the benefits of a government policy outweigh its costs. Governments often provide for national defense, address environmental concerns, define and protect property rights, and attempt to make markets more competitive. Most government policies also redistribute income.
- Benchmark 8: Governments provide an alternative method to markets for supplying goods and services when it appears that the benefits to society of doing so outweigh the costs to society. Not all individuals will bear the same costs or share the same benefits of those policies.
CONTENT STANDARD 20
Students will understand that federal government budgetary policy and the Federal Reserve System’s monetary policy influence the overall levels of employment, output, and prices.
- Benchmark 4: The federal government’s annual budget is balanced when its revenues from taxes and user fees equal its expenditures. The government runs a budget deficit when its expenditures exceed its revenues. The government runs a surplus when its revenues exceed its expenditures.
- Benchmark 5: When the government runs a budget deficit, it must borrow from individuals, corporations, or financial institutions to finance that deficit.
- Benchmark 6: The national debt is the total amount of money the federal government owes. This is the accumulated net sum of its annual deficits and surpluses. The government pays interest on the money it borrows to finance the national debt.
Activity: Myth Busters – The National Debt
Procedures
Use the 10 Myth Buster Questions in the Kahoot game to explore what students know or think they know about the national debt.
- Option 1: Use Lesson 1 Essential Understandings to teach and answer questions as you progress through the questions in the Kahoot game.
- Option 2: Use the questions in Kahoot as a quick game at the beginning of the lesson to introduce the topic, then teach the Lesson 1 Essential Understandings or assign it as a student reading after class.
Myth Buster Questions & Answers
- What is the size of the U.S. Federal Debt in 2023? (A: $31.6 Trillion as of January 2023) See U.S. Debt Clock for Cuhttps://www.usdebtclock.org/
- How does the Federal Government borrow money? (A: by selling bonds to investors)
- Has the federal government ever defaulted on its debt? (A: Yes – once since Andrew Hamilton, 1st Secretary of the Treasury 1789-1795.)
- When did the U.S. Government default on its debt? (A: 1979 -Treasury couldn’t make payments on T-bills maturing April 26, May 3, and May 10, 1979, amidst a debt ceiling showdown in Congress. They eventually made the investors whole and paid additional interest, but T-bill interest rates increased 60 basis points and remained high for months after the event.)https://www.forbes.com/sites/beltway/2013/10/08/actually-the-united-states-has-defaulted-before/?sh=558607bd6021
- What is the larger number in 2023? (A: National Debt. The national debt was even larger than GDP in 2023.) See U.S. Debt Clock for current numbers: https://www.usdebtclock.org/
- Who owes more? State governments combined, Local governments combined, U.S. Consumers combined, or the Federal Government? (A: Federal Government. 2023 – States combined 1.2 Trillion; Local Government, 2.3 Trillion; U.S. Citizens, 24 Trillion; U.S. Government, 31.6 Trillion. See U.S. Debt Clock for current numbers: https://www.usdebtclock.org/
- To whom does the Federal Government owe the Debt?
- U.S. Investors (37%)
- Foreign Investors (23%)
- Government Programs and Trust Funds (21%)
- Federal Reserve (20%)
- As of Q3 2022: 30.6 Trillion total debt: U.S. Investors 11.4 Trillion; Foreign Investors 7.3 Trillion, Intragovernmental Holdings 6.7 Trillion, Federal Reserve 6.1 Trillion.
- Sources for Private and Federal Reserve: https://fred.stlouisfed.org/graph/?g=jwG3&utm_campaign=myfred_referrer&utm_medium=exported-chart&utm_source=direct
- Source for Intragovernmental Holdings: https://www.treasurydirect.gov/govt/reports/pd/pd_debttothepenny.htm
- Interest payments on the debt as a percentage of GDP are at an all-time high. T/F? (A: False. Interest payments on the debt have ranged between 1.2 and 3% since 1962. In 2023, interest payments were 1.6% of GDP. They were 3% in the 1990s.)
- If each U.S. Citizen pitched in $18K, we could pay off the national debt. T/F (A: False. In 2023, it would take $94.300 per citizen or $246,000 per taxpayer to pay off the National Debt)
- The wealth of all the billionaires in the U.S. is enough to pay off the national debt and leave each with $1 billion. (A: False). As of November 2022 there were over 700 billionaires in the U.S. with about 4.8 Trillion in wealth. https://www.forbes.com/real-time-billionaires/#b77387c3d788
Lesson 1 Essential Understandings
What is the Federal Debt, and Why Is It Important?
The Federal debt the United States government holds is important for interest rates, investment decisions, and economic growth. The amount of debt held by the public today stands at double the amount held in 1960. Because of the potential economic implications of the national debt, it is important to understand what it is, how it is financed, what drives changes in the national debt over time, and where the national debt is projected to go.
- The debt is the sum of all past deficits and surpluses, while a deficit is an annual amount of how much expenses exceed revenues for the government.
- The debt is measured at a point in time, and the deficit is measured over a span of time, usually one fiscal year.
For example, in 2019, the federal government spent $4.447 trillion, but the federal government only collected revenues of $3.462 trillion (Congressional Budget Office, 2020). That means the federal government “ran a deficit” of about $992.1 billion. The deficit added to the stock of pre-existing government debt, which at the end of 2019 was equal to about $22.7 trillion.
Why does the government spend so much money each year?
Some Economists like to refer to the federal government as a large insurance company with a military.[1]
- The government acts as a large insurance company because it provides income support for bad outcomes, unemployment, illness, and disability that private insurance companies may not cover.
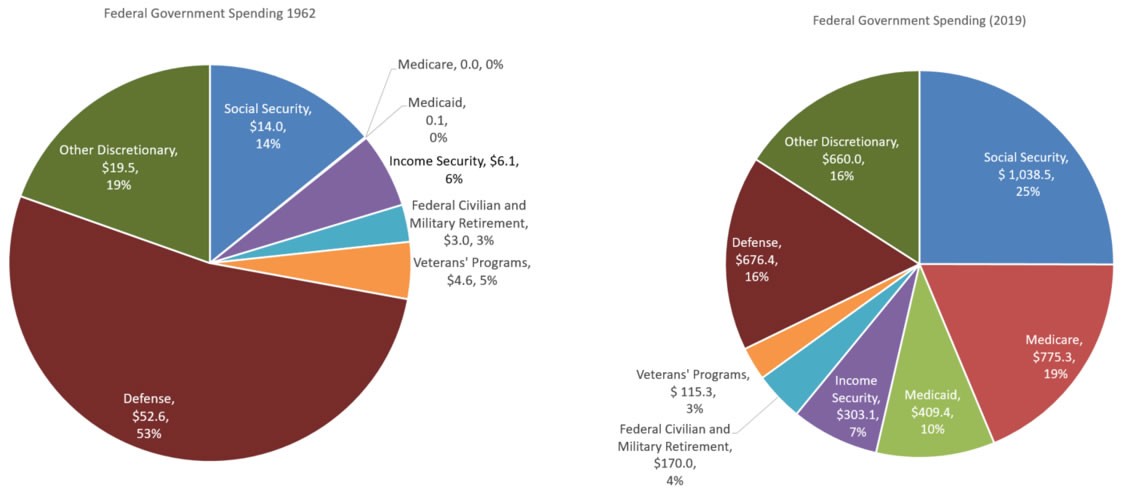
- The federal government spent $1,039 billion on Social Security and $775.3 billion on Medicare in 2019 (Congressional Budget Office, 2020).
- The insurance aspect of the government has grown over time in terms of the size and the number of programs.
In addition to this function, the United States government spends a significant amount on defense.
- The federal government spent $676.4 billion on national defense.
- Social Security, Medicare, and Defense— account for almost $2,500 billion ($2.5 trillion) of spending.
- There are other (smaller) programs that the federal government runs or supports, such as education, Medicaid, research grants, welfare, the FDA, etc.
- Figure 1 depicts total government expenditures for 1962 compared to expenditures in 2019. Not only has the amount of government spending changed over time, but so has the composition of government spending. In particular, notice how spending has shifted from the military to Social Security and Medicare/Medicaid.
Figure 1: Government Spending 1962 and 2019
Government expenditures fall into two categories of either mandatory spending or discretionary spending.
- Mandatory expenditures are those that the federal government must make either because a law or statute requires it, such as Social Security, or we have a contractual obligation, such as interest payments on federal borrowing.
- Discretionary expenditures are those that are not required by law, but are approved by Congress, such as defense spending or funds to improve highways. This will be covered more in lesson # 2.
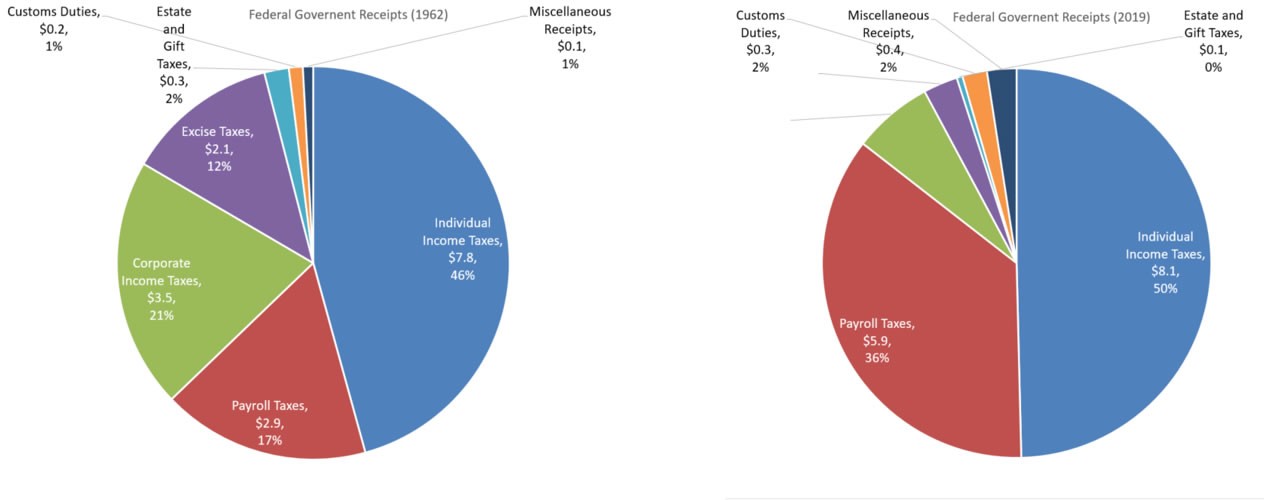
The government revenues that pay for the annual expenses are made up of individual, and corporate income tax revenues, payroll taxes, import taxes (tariffs), and a few other federal fees and taxes. Individual and corporate income taxes plus payroll taxes make up more than ninety percent of the annual revenues. See Figure 2.
Figure 2: Tax Revenues by Source
The Federal Budget
While the focus of this unit is on the Federal debt and deficit, it is instructive to include an overview of the Federal Budget process, eventual expenditures and revenues, and the resulting debt or surplus for a given fiscal year. The process includes these key steps:
- The President submits a budget request to Congress.
- The House Budget Committee and the Senate Committee on the Budget develop and pass budget resolution bills in their respective chambers. These bills take into account desired discretionary expenditures, mandatory expenditures, and taxing and borrowing revenues for the coming year.
- House and Senate Appropriations Committees determine the precise levels of budget authority for all discretionary programs.
- The House and Senate each pass their own Appropriations bills and then reconcile any differences.
- The President signs Appropriations Bill, and the Budget becomes law.
- From time to time, the government responds to unanticipated situations, (COVID-19 for example). To do so, funding must be allocated by Congress through supplemental appropriations.
Underlying all of this is the work of the Congressional Budget Office (CBO)
- CBO’s work follows processes specified in the Budget act and developed by the agency in concert with the House and Senate Budget Committees.
- CBO’s chief responsibility is to help the respective budget committees with matters under their jurisdiction and to support the work of other congressional committees.
- CBO produces the annual Budget and Economic Outlook along with other reports.
- CBO is required by law to produce a formal cost estimate for nearly every bill approved in Congress, as well as all of the work of the Appropriations Committees.
- CBO projections are based on a Baseline Budget that makes the assumption that current laws about federal spending and revenues will generally remain in place.
As was noted earlier, in most years of our recent history, government revenues have not been large enough to pay for all of the government expenses, and we have run a deficit. When this happens, it is up to the Treasury (by law) to borrow enough money to pay for the deficit. The Treasury issues and sells Bonds to raise the needed revenues.
- They may borrow on a very short-term basis with the sale of a Treasury Bill (T-Bill) that is usually repaid in about ninety days, or a Treasury note that is a bit longer in duration, usually about 180 days.
- They can also sell Treasury Bonds, which have a much longer maturity of 10-30 years.
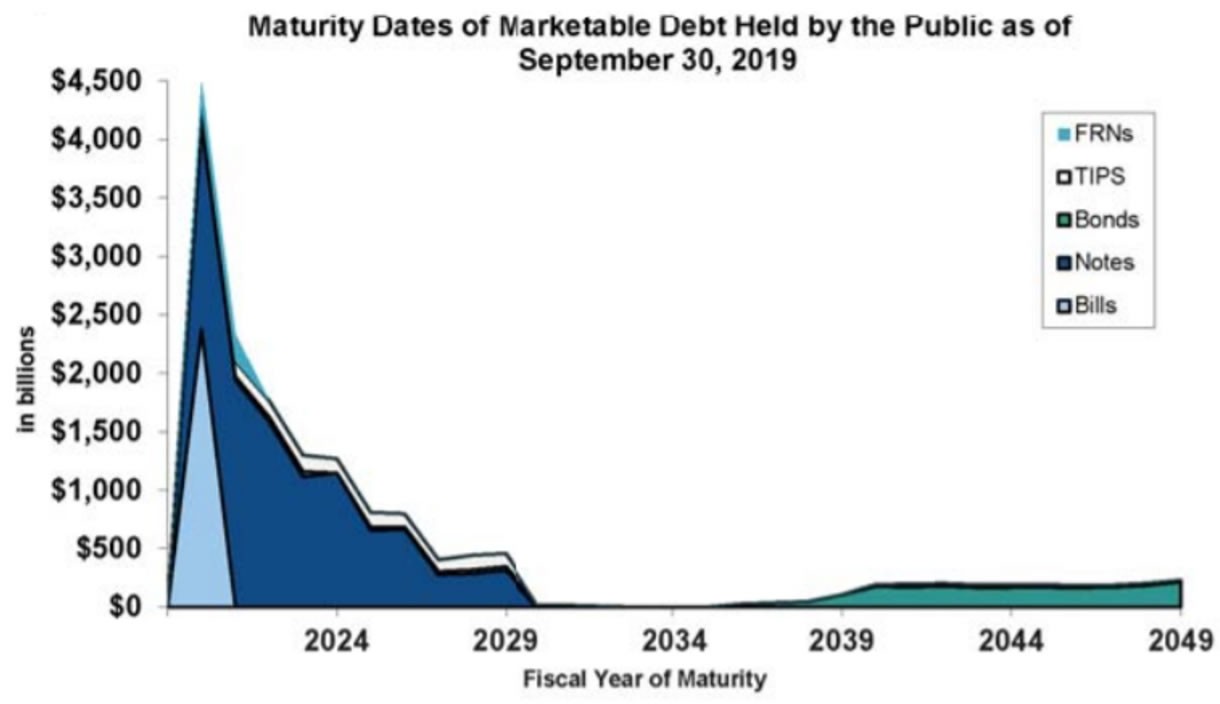
- The majority of government debt is due to be paid back in the next ten years, and a significant proportion is due prior to 2024. Figure 3 below presents the current time to maturity for debt owed by the U.S. government.
Figure 3: Maturity Dates of Federal Debt
- Each year the Treasury must not only borrow enough money to cover the current annual deficit but must also borrow enough to repay debt that is coming due.
- Only the interest due on the debt is included in the annual Federal budget.
- The current interest rate that the Treasury must pay impacts the borrowing for far more than the amount of the current deficit.
Expenditures, Revenues, Deficits, and Debt Over Time
- It is common practice to use debts and deficits relative to GDP to track changes over time.
- By using GDP as a benchmark, there is no need to worry about prices in different years if all measures are reported as a percentage of GDP.
- Thinking about things as a percentage of GDP allows us to make comparisons of government activities relative to the size of the economy.
- The total size of economic activity in the United States is different today than it was 45 years ago; scaling by GDP allows us to see how the deficits and debts are changing relative to the size of the economy.
Spending $10 billion in 1975 is very different from spending $10 billion in 2030 due to inflation and the difference in the size of the U.S. economy.
- This relative measurement also makes it easier to compare government activities across countries at a point in time.
This unit will focus primarily on the debt and deficit from 1962 through 2019. This period is emphasized because we have detailed breakdowns of government expenditures and government receipts. However, in order to get a longer-run view of the expenditures and receipts in the United States, figure 4 is included to show the federal expenditures as a share of GDP from 1792 until 2008. The historical fiscal situation is taken from Miron, 2016.
- It is clear from this figure that during each war in U.S. history through the 1970s, there was a notable increase in expenditures.
- Also interesting about these increases in expenditures is that the level of expenditures does not seem to return to the previous levels they were before the start of the conflicts.
Figure 4: Historical Federal Expenditures as a Share of GDP
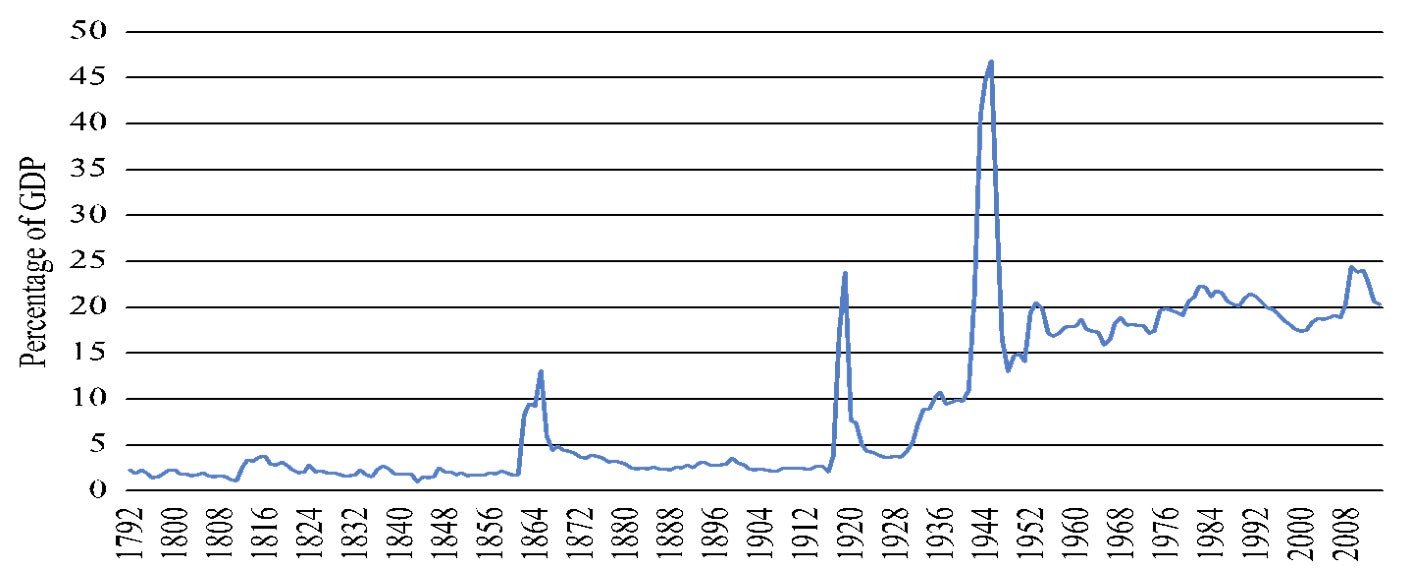
Figure 5 depicts federal revenues over this time period as well.
Figure 5: Historical Government Receipts as a Share of GDP
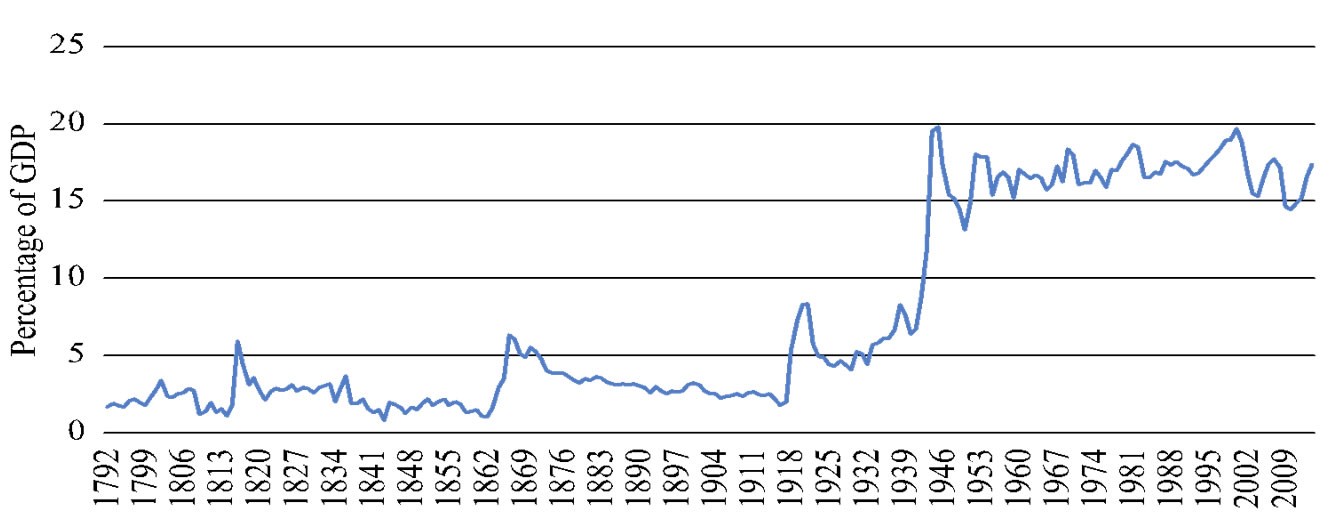
- There is an increase in revenues that also occurs around these conflicts.
- Figure 5 also shows that government receipts tend to decline after the end of the wars, but receipts typically remain above the pre-war levels after each conflict.
- While government receipts were never above 10 percent of GDP prior to World War II, government receipts have been above 15 percent of GDP for nearly every year since the end of World II.
Tax Revenues
In 2019, the Federal Government collected $3,462.2 billion in taxes. That comes out to about $22,000 per employee or $10,500 for every person in the United States.
- As a share of GDP, tax revenues were a little over 16 percent in 2019.
- The tax revenues for the federal government come primarily from three sources: individual income taxes, payroll taxes, and corporate income taxes.
- These three taxes account for more than 90% of tax revenues. Figure 2 depicts tax receipts from 1960-2019.
- Federal income taxes account for about 50 percent of federal tax revenues.
- Payroll taxes, which include taxes collected to fund social security, Medicare, and part of Medicaid, account for about 36 percent of federal tax revenues.
- Corporate income taxes account for about seven percent of federal revenues.
- Excise taxes and customs duties (tariffs) account for three percent and two percent. All other taxes account for a little over two percent of the government’s revenue.
Figure 6: Tax Receipts (1962–2019)
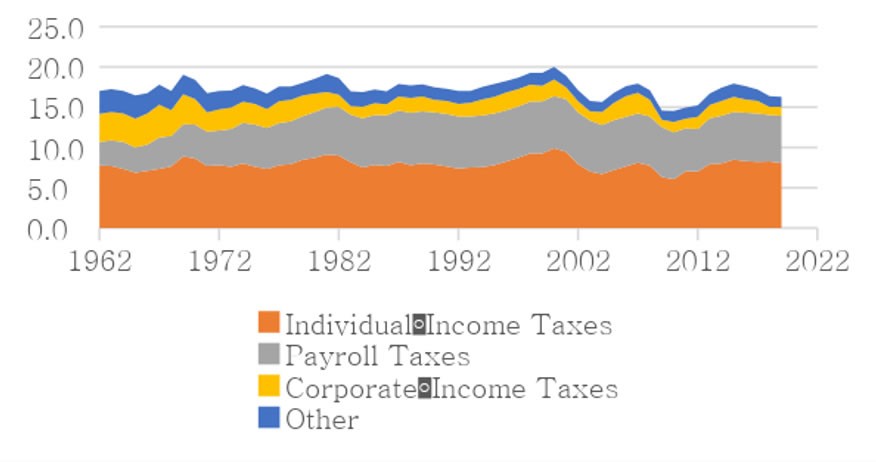
Figure 7 shows the historical government debt as a share of GDP.
Figure 7: Historical Debt-to-GDP Ratio
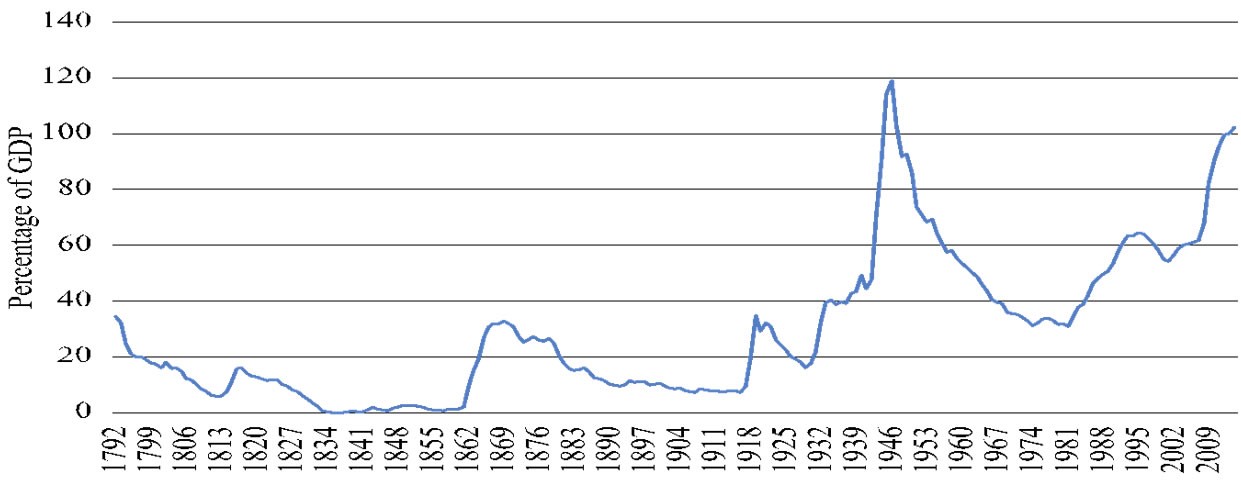
- Wars are typically financed over time, so we see that the debt-to-GDP ratio rises during war times and then tends to decline over time.
- Following the Civil War, the debt-to-GDP ratio falls but does not return to zero. In fact, after each war, government debt does not return to the pre-war government debt levels.
- Over the last several decades, the debt-to-GDP ratio has continued to rise, and it is at levels that are similar to the peak of World War II.
Examination of Federal Government Expenditures 1962-2019
Figure 8 depicts federal government expenditures as a share of GDP 1962-2019.
Figure 8: Outlays, Revenues and the Budget Balance as a Percentage of GDP
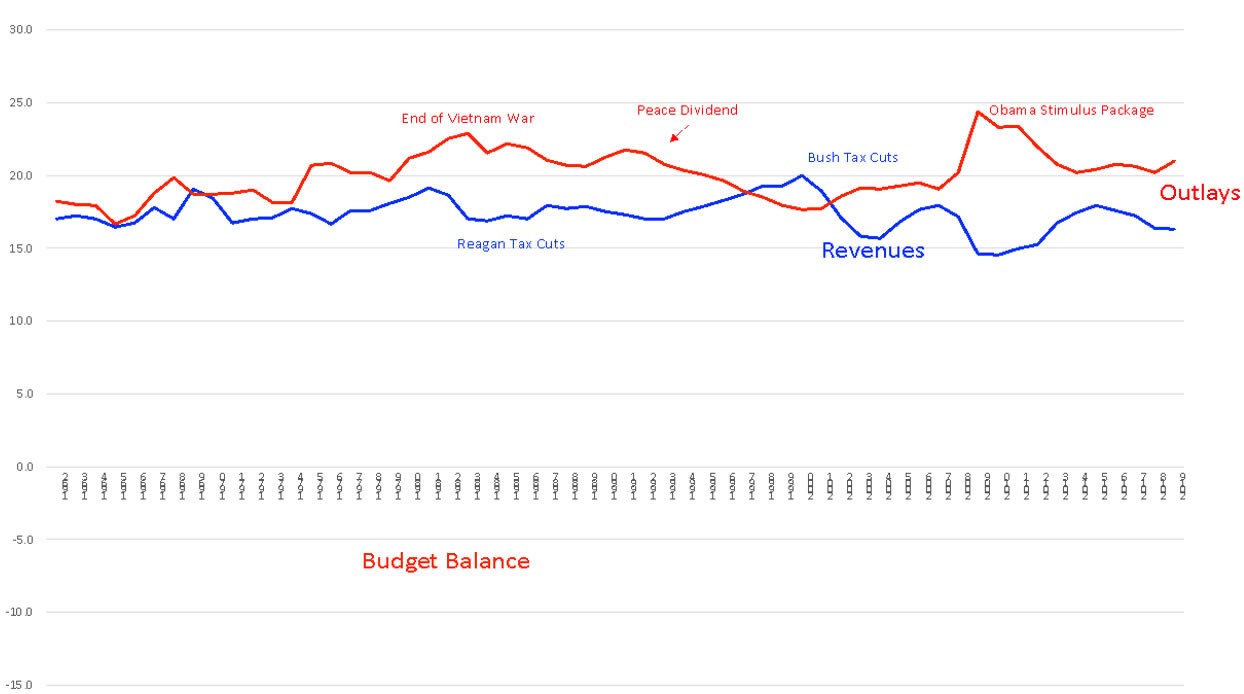
Source: Congressional Budget Office.
- Expenditures, on average, are centered at around 20% of GDP for the period 1962—2019.
- You can clearly see increases in expenditures during the Vietnam War and the two Gulf Wars and a reduction in spending following the collapse of the Berlin Wall, which marked the end of the Cold War.
- Federal government revenues as a share of GDP over this time period averaged 17.3% of GDP.
- Through most of the period from 1962—2019, the government was running a deficit.
- In some of these years, the larger deficits are partially driven by tax cuts, increased spending for the wars in Iraq and Afghanistan, and the abnormally low revenues and abnormally high spending that occurred after the Great Recession.
Debt held by the public.
At the end of 2019, the total debt of the U.S. government was $22.7 trillion or 104% of GDP. However, some of the government debt is held by other government agencies. The total amount of intragovernmental borrowing is $5.9 trillion. We typically do not count the amount of money the government borrows from itself, so a more meaningful measure is debt held by the public.
- The debt held by the public includes debt held by individuals, corporations, state or local governments, the Federal Reserve Banks, foreign governments, and entities outside the U.S.
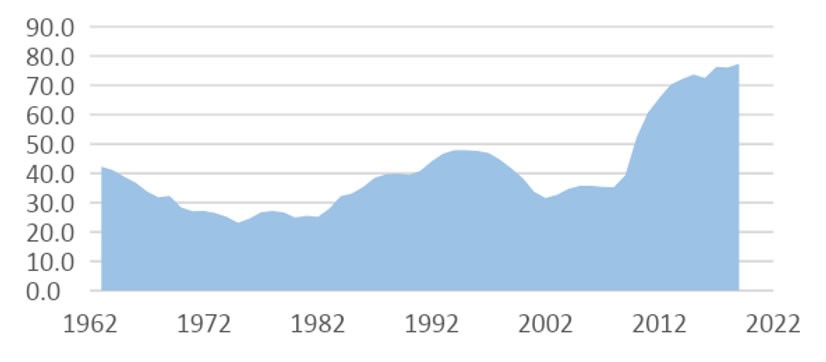
- Over the period 1962—2019, the period where we have reliable data, there is a trend of growth in the debt.
- In 1962, the federal debt was equal to 42.3% of GDP. By 2019 that figure stands at 79% of GDP.
- While the debt has been growing over time, the growth rate has not been constant.
- The evolution of the federal debt from 1962 to 2019 is depicted in Figure 9.
Figure 9: Federal Debt Held By Public
Source: Congressional Budget Office.
The Impact of COVID – 19
In response to the coronavirus pandemic, the federal government passed several bills to try to address the health-related issues associated with the pandemic as well as the pandemic’s effect on the economy. The passage of bills to address the pandemic began on March 6th and continues as of the writing of this unit. Today these measures have totaled over $2 Trillion.
- The response by the federal government increased the projected deficit to GDP ratio from nearly 5% of GDP to almost 20 percent of GDP in 2020.
- It is also anticipated that the deficit will be nearly 10% of GDP in 2021.
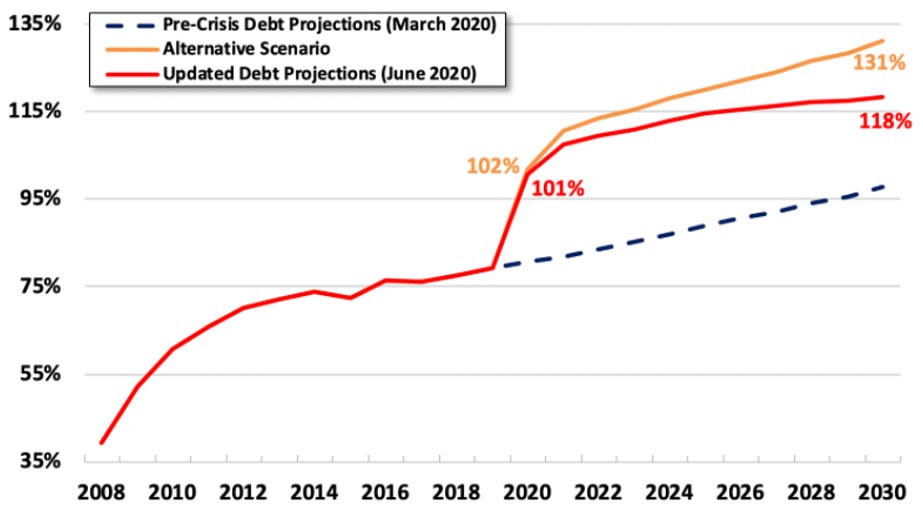
- The increase has pushed the debt held by public-to-GDP ratio from an expected 80 percent of GDP to over 100 percent of GDP.
- The pandemic has also increased total projected deficits for 2020–2030 from 16.9 trillion dollars to 23.9 trillion dollars (Committee for a Responsible Federal Budget, 2020).
Figure 10 and Figure 11 are taken directly from the Committee for a Responsible Federal Budget and show how big of an impact COVID-19 has had on federal deficits and the debt based on their models (Committee for a Responsible Federal Budget, 2020).
Figure 10: Projected Impact of COVID-19 on Federal Deficits
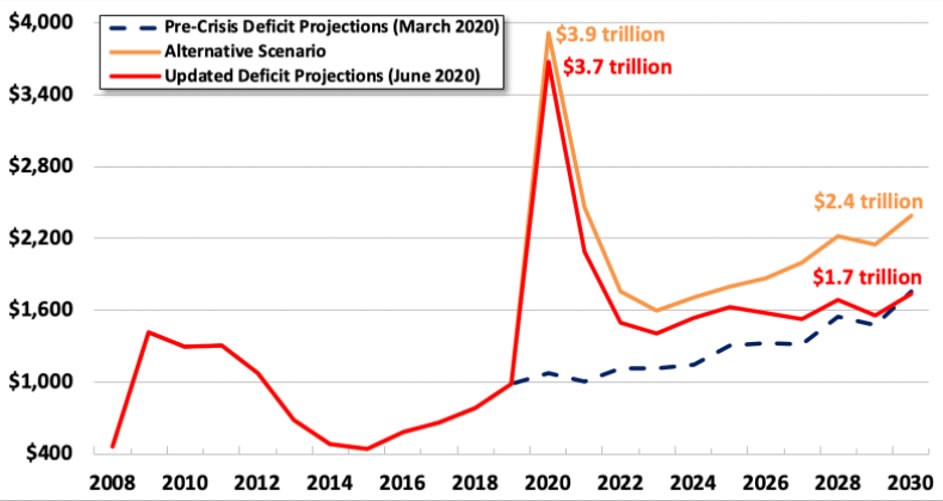
Figure 11: Projected Impact of COVID-19 on the Federal Debt
Source: Committee for a Responsible Federal Budget
This large response to the pandemic is analogous to fighting a war. Therefore, it would not be surprising to see the deficits and debt to GDP ratios resemble that of World War II. Using debt to respond to the pandemic allows the full cost to be paid over a period of time, just as large responses to wartime efforts allowed us to pay those costs over a period of time.
Looking to the future
Now that we have seen what the historical picture of the debt, deficits, mandatory spending, discretionary spending, and revenues look like, let’s look at projected spending levels and deficits for 2020—2030. Figure 16 shows that:
- Federal spending as a percentage of GDP is projected to increase from 21% to about 23.5% during the 2020s.
- The projected increase in spending will culminate in a projected deficit increase of about 1% of GDP per year, from just under 5% to just under 6%.
- The growth will be driven by increases in mandatory spending, which is projected to increase from just under 13% to just over 15% of GDP per year.
- Net interest on the debt is also projected to increase during the 2020s from under 2% to over 2.5% of GDP per year.
- Discretionary spending is projected to continue its decline from 6.25% to 5.6% per year.
- Increases in the deficit are likely to be driven primarily by the increases in mandatory spending.
There are several reasons to have concerns about the current and projected path of government spending and revenues and the corresponding additional debt with these deficits.
The amount the government borrows each year may impact credit markets, which may slow economic growth.
- The government borrows in the same credit markets as businesses and consumers, and when the government borrows more, it can put upward pressure on the price of credit; that is, interest rates can rise.
- If interest rates rise, firms may be less likely to borrow to build new factories, buy new machines, or invest in other projects that may increase worker productivity and promote economic growth.
Resources
Baier, Scott, and Benjamin Posmanick. “Federal Debts and Deficits: Past, Present and Future.” Foundation for Teaching Economics, 15 Dec. 2020, www.fte.org.
Sheiner, Louise and Kadija Yilla. “Federal Debt Policy in an Era of Low Interest Rates: A Guide to the Issues.” Hutchins Center on Fiscal & Monetary Policy, Brookings Institute, 5 Nov. 2020, www.brookings.edu.
[1] It is not clear where the quote originated, but it can be traced back to a comment made by Peter Fisher in 2002 when he served as undersecretary of the United Sates Treasury. (https://economistsview.typepad.com/economistsview/2013/01/who-first-said-the-us-is-an-insurance-company-with-an-army.html).
Recent Blog Posts
View More
Tell Our Elected Officials to Enroll in FTE Programs, Please!
January 30, 2026 Despite last-minute negotiations late this week, President Trump and congressional leaders appear to once again be on…

Foundation for Teaching Economics Opens Student Application for Summer 2026
January 12, 2026 The Foundation for Teaching Economics is pleased to announce that applications for Summer 2026 student programs are…

Making Economics Meaningful for Students
December 19, 2025 The Fund for American Studies’ Liberty and Leadership podcast features FTE’s own Amanda Stiglbauer, a longtime member of our…

