Lesson 4 Appendix: State and City Budget and Financial Reporting

- >
- Teachers
- >
- Teacher Resources
- >
- Lesson Plans
- >
- Making Sense of the Federal Budget, Debt & Deficits
- >
- Lesson 4 Appendix: State and C…
Lesson Overview
Understanding the financial standing of state governments is not easy. Balanced budgets don’t have to balance and reading financial reports can feel like reading in a foreign language. This lesson breaks down the political language and process of state budgeting and reporting that allow state policymakers to profess balanced budgets while borrowing money at the same time. In the accompanying activity, students use Data-Z. This online tool aggregates state financial data to compare the financial situation of their state with 3 other states and make a prescription to improve the fiscal health of their state.
Key Terms & Economic Concepts
- Accrual Accounting
- Budget
- Cash Accounting
- Debt
- Decision Making
- Deficit
- Fiscal Policy
- Interest
- Opportunity Cost
- Trade-offs
Content Standards
Voluntary National Content Standards in Economics
CONTENT STANDARD 20
Federal government budgetary policy and the Federal Reserve System’s monetary policy influence the overall levels of employment, output, and prices.
Benchmark 5: When the government runs a budget deficit, it must borrow from individuals, corporations, or financial institutions to finance that deficit.
Materials
- Data-Z State Data Comparison Tool: https://www.data-z.org/
- Mobile device or computer (1 per student)
- Handout 1: States’ Fiscal Health Check-Up
- Optional: Lesson 4 Appendix Essential Understandings, if assigned as a student reading (1 copy per student)
Activity: The Fiscal Health of States
Procedures
-
- Use the Lesson 4 Appendix Essential Understandings to introduce students to state budgets and financial reporting.
- ALTERNATIVE: Assign the Lesson 4 Appendix Essential Understandings as a student reading the day before running the Lesson 4 Activity: The Fiscal Health of States
- Give students a copy of Handout 1: States’ Fiscal Health Check-Up
- Ask them to compare the fiscal health of 4 states at https://www.data-z.org/. Their choice of states should include a state that ranks in the top 5, a state that ranks in the bottom 5, and their own state.
- Debrief Questions
- Did the fiscal health of the states you examined improve or worsen from the previous year? Why? (Answers will vary.)
- Why might a state want to run a deficit? (They may want to invest in infrastructure, provide disaster relief, etc.)
- What kinds of things are financed by state borrowing? How does it compare to federal borrowing? (Much of state government borrowing is used to finance infrastructure, whereas federal government borrowing is largely used to pay for current consumption. Spending on infrastructure is an investment in that it can result in greater productivity and economic growth in the future.)
- Is the opportunity cost question “to spend or not to spend,” or is it a question of “where to spend?” (It depends on who you ask. Fiscally conservative people are more likely to see the alternatives in terms of spending or not spending (meaning lower tax obligations for current and future citizens. Others may see the alternatives in terms of spending in one area vs. spending in another.)
- What recommendations would you give to improve your state’s fiscal health? (Answers will vary.)
Resources
Bergman, Bill. “State Budgets: The Good and the Bad.” Foundation for Teaching Economics, 2020, www.fte.org
“Data-Z.” Data-Z, Truth in Accounting, www.data-z.org. Accessed 20 Apr. 2021.
Lesson 4 Appendix: Essential Understandings
Like Federal Government financial reporting, city and state government must have budgets and financial reports that are kept and made available to the public. For the most part, these reports are similar to federal reports in that budgets project future expenditures and revenues, and the financial reports show net positions of activity and assets and liabilities.
However, there are a few key differences between federal and state and local finances that are not only cause for looking at them a little differently but also the root of practices that some people feel allow state and city officials to be less transparent in the reporting.
State Budgets
Currently, 49 of the 50 states have a “balanced budget” requirement in their state law. Given this, a simple question might be—if states balance their budgets every year, how could so many of them have accumulated so much debt? A short answer to a sometimes long story is that states and cities can balance their budgets using borrowed money as revenue and not counting all expenses if cash is not going out in the current period. This is not the story of all states and cities, but unfortunately, it is the story of many of them.
State and local budgets will provide projections on anticipated expenses to run all aspects of the respective state or city. These expenses will generally include items that range from low-income housing assistance to youth athletic programs and street repairs.
It is important to note that they also include payments to be made to pension and retirement benefit plans for state and local employees. Herein lies one of the concerns of state and city budgeting because what is planned or projected to be paid into the pension and benefit plans may not be the amounts necessary to “fund” the future benefits to be paid from those programs. The “budget” will only include the actual cash amount to be paid to the retirement program in the upcoming year when the accrued or long-term expense is anticipated to be much larger.
Using cash budgeting rather than accrual-based budgeting will understate the long-term expense for the state or city. Thus on a cash expense budget basis, the budget is balanced, while if it were on an accrual basis, the budget could show a significant deficit.
The budgeted, or projected, revenue sources will include things such as sales tax, property tax, certain fees, and grants from the federal government or other entities. All of these sources show up under “General Revenues.” But what if the budgeted expenses are greater than the anticipated revenues? Accounting standards allow projected borrowing to be included in General Revenues. Thus, a city might plan to borrow $100,000 (from a bank, a bond issue, etc.) and show that as revenue, then spend $90,000 of that and be left with a $10,000 “surplus” in the budget. All while they went $100,000 in debt.
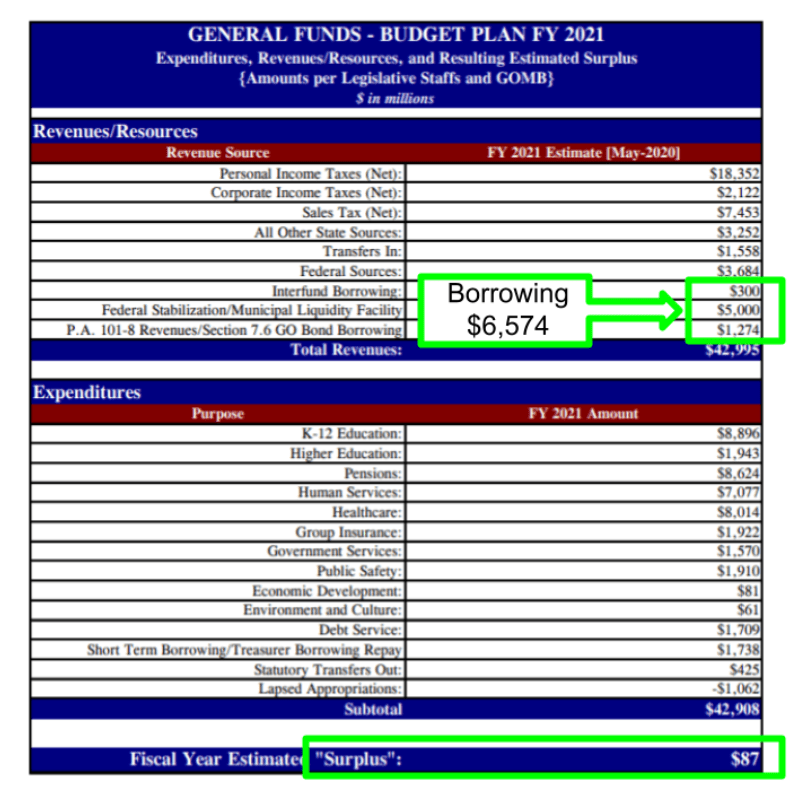
Below is a real-world example from the state of Indiana’s 2021 published budget plan. On the following chart under projected revenues, the last three entries are all sources of borrowing that they anticipate using—these total $6,574 million, which is being counted in the General Revenue total.
The anticipated expenses are listed on the lower half of the chart, and when those expenses are subtracted from the revenues, there is a projected $87 million “surplus” in the budget. All while the state of Indiana assumes an additional $6,574 million of debt.

State Financial Reports
State and local governments produce “Comprehensive Annual Financial Reports” (CAFRs). These reports, like federal reports, include two main end-of-year financial statements, the Statement of Activities (like the private sector income statement) and the Statement of Net position (like the private sector balance sheet). Each statement arrives at a plus or minus net position, the expenses compared to revenues or assets compared to liabilities.
State and local “Statements of Activity” will include expense categories like public safety, public works, health and welfare, economic development, and interest. There are often “off-setting” amounts which can be fees or charges for service and grants that are deducted from the expense categories.
The revenue section of the Statement of Activity, which is usually the bottom half of the statement, will include “General Revenues.” General Revenues will be made up of taxes, property, and sales for cities and income and gasoline, sales and property for states. Borrowed funds will not be listed as revenues on the Statement of Activity. When the expenses are subtracted from the general revenues, we get the positive or negative result of the year’s activity – the Net Position for the year’s activity. Per the state of Indiana’s 2021 budget plan, we could expect a Statement of Activity that will show a loss of $6,487 million. Where does that loss or negative position show up? —on the “Statement of Net Position.”
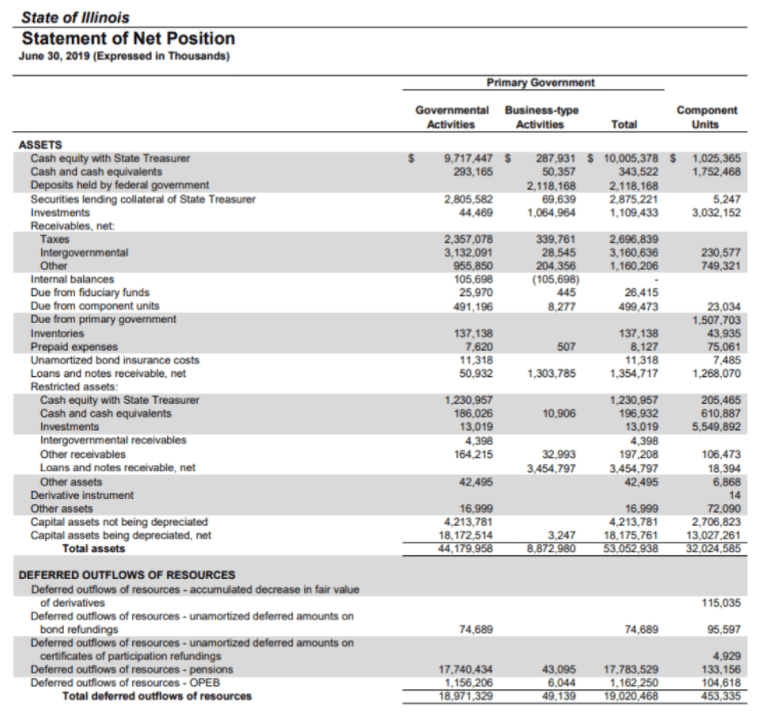
The Statement of Net Position (or private sector balance sheet) states the assets minus liabilities that lead to a positive or negative net position. Remember that the Statement of Activities is for activity over a period of time, and the Statement of Net Position reflects a point in time, such as the end of a fiscal year. The top half of the Statement of Net Position includes various categories of assets, such as cash, investments, various types of receivables, and capital assets like land, infrastructure, and construction in progress.
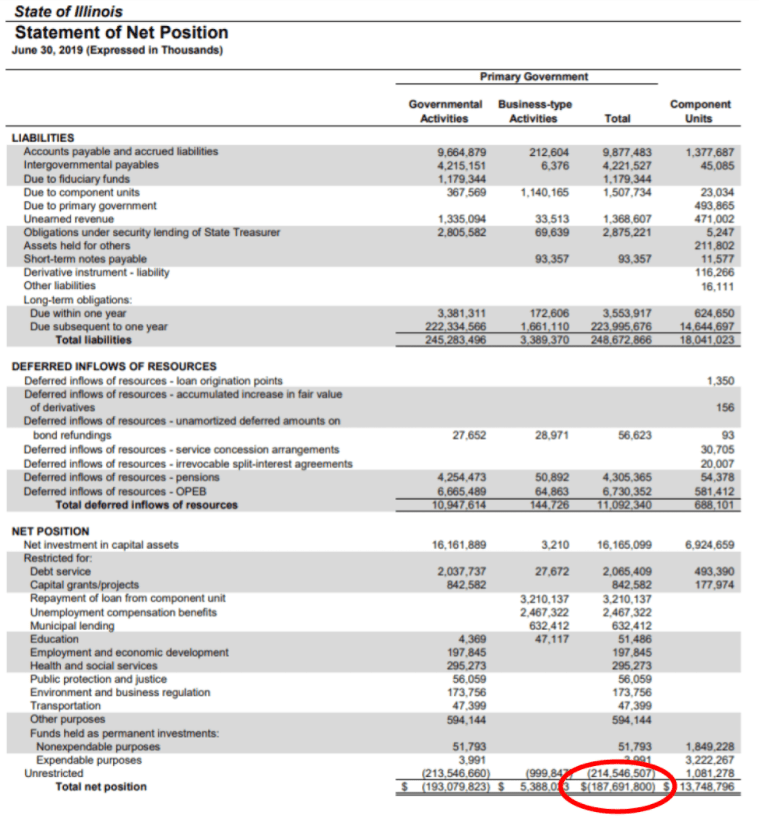
The bottom half of the Statement of Net Position lists Liabilities that are subtracted from the Assets to determine a Net Position of deficit or surplus at that point in time.
In the liabilities section, you will see the same sorts of things that you would see on a private sector balance sheet—accounts payable, interest payable, and other payables. On most state or city balance sheets, you will see a section of Long-term liabilities, which include bonded debts and employee benefit program obligations. Just who those obligations are owed to can usually be found in a footnote to the statement. Any borrowing or indebtedness that a state or city has incurred to meet expenses or fund pension or retirement programs will be listed as a liability.
Following is the Statement of Net Position for the state of Indiana for 2019. You can see that the state has very significant liabilities on the bottom line of the statement (bottom of the second page). Notice the number in parentheses. On financial statements, a number in parentheses means the number is negative.


For most states and cities, the Long-term liabilities are by far the largest portion of all liabilities reported. This has not always been the case, and in fact, it is only in recent years that most of the Long-term liabilities of states and cities have been reported on the Net Position statement. In 2015 accounting standards were changed so that these Long-term liabilities had to be listed. First, the pension liabilities in 2015 and then medical retirement benefits in 2017. Prior to that change in accounting standards, leaving these liabilities off of the net position statement made the position look far more positive than it was and supported claims of “balanced budgets” even when there were massive unreported liabilities.
If you choose to examine the Statement of Net Position for a number of states and cities over the years of 2014-2018, you will see that for most the long-term liabilities increased dramatically in 2015 and again in 2017—not because real debt increased, but because state and local governments now had to report those obligations as debt.
In examining those same statements, usually in the footnotes, you can find the amount of the Long-term debt that is for pensions, healthcare, and other post-employment benefits and the portion that is for bonded debt. You will find in the case of most states and cities the liabilities of pension, healthcare, and post-employment benefits will be close to or greater than the bonded portion of the debt.
If the net position is negative, then that is an amount that will need to be paid in the future by the taxpayers. So the decisions of the current state and city governments to operate in a negative position put the burden on the taxpayers into the future, often many years after the state and city officials are out of office or retired.
An example of a city with massive long-term retirement benefit liabilities is Chicago, at over $28 billion. How did they get in this position? A third element of the financial reports can shed some light on that. There is an unaudited section at the end of most annual reports called “Statistical Information.” This statistical information is presented in a table that covers a number of years and tracks the deficit position of a state or city. The bottom line here will tell us if the net position each year is continuing to get worse or better. Again, to pick on Chicago, their net position has been negative every year since 2009 while claiming to have balanced budgets throughout that time.
At some point, the long-term liabilities can put a state or city literally at risk of becoming insolvent or going bankrupt. If their liability position has become too bad, they will not find a lender or lenders willing to extend credit to the state or city, and they will be in a default position on their retirement and bond obligations. When this happens, cities often turn to the state for help and states, who cannot legally go “bankrupt” will look to the federal government or the Federal Reserve Bank for help.
While states cannot legally go bankrupt, they can default on debt. The best (and only) example of this is Arkansas in 1933. In the midst of the Great Depression, they found themselves unable to make payments on their highway bonds. The bondholders sued, and the state had to restructure and prioritize their debt. Some bondholders lost their money. Defaulting on debt means the institution will have to pay higher interest rates to borrow money in the future as lenders will see the loans as riskier.
In March of 2020, amidst the COVID Pandemic, the Federal Reserve Bank of the United States announced that it would enter the municipal bond market for the first time in its history. So effectively, states and local governments can now borrow at lower interest rates because the Federal Reserve Bank is willing to buy city and state debt.
Conclusion
To summarize, the two biggest concerns about state and city finances are that they can balance projected and actual budgets with borrowed funds (revenues), and they can choose to pay less into retirement accounts (cash expense) than those programs need on an annual basis (accrued expenditures) to be funded for future retirements. The 2015 and 2017 changes in accounting practices have forced states and cities to produce financial statements with a much clearer understanding of liabilities, but they have not done anything to move away from counting borrowed funds as general revenues in the budgeting process.
There are organizations dedicated to tracking, monitoring, and analyzing state and city financial practices. Two of those are the Volcker Alliance and Truth in Accounting. Both have websites where you can see reports and compare state and city financial performance.
Sources
Bergman, Bill. “State Budgets: The Good and the Bad.” Foundation for Teaching Economics, 2020, www.fte.org
Commission on Government Forecasting & Accountability; Illinois General Assembly. State of Illinois Budget Summary Fiscal Year 2021. https://cgfa.ilga.gov/Upload/FY2021BudgetSummary.pdf
Ergungor, O. Emre, 2016. “Sovereign Default in the US,” Federal Reserve Bank of Cleveland Working Paper, no. 16-09
Mendoza, Susana A. (2019). State of Illinois Comprehensive Annual Financial Report 2019. https://illinoiscomptroller.gov/financial-data/find-a-report/comprehensive-reporting/comprehensive-annual-financial-report/fiscal-year-2019/
Handout 1: States’ Fiscal Health Check-Up
Directions:
Compare the fiscal health of 4 states at https://www.data-z.org/. Include a state that ranks in the top 5, a state that ranks in the bottom 5, and your state. Fill in the table below with your findings.
| Your State:______________ | “Top 5” State:______________ | “Bottom 5” State:______________ | Other state:______________ | |
| Assets available to pay bills | ||||
| Total Bills | ||||
| Each Taxpayer’s share of debt (-) or surplus (+) | ||||
| Ranking out of 50 | ||||
| How does this year’s debt or surplus compare to years past? Is there a trend? | ||||
| What is an interesting fact you learned about this state’s fiscal health? |
What recommendations would you give your state to improve its fiscal health?

Tell Our Elected Officials to Enroll in FTE Programs, Please!
January 30, 2026 Thanks to/despite last-minute negotiations late this week, President Trump and congressional leaders appear to once again be…

Foundation for Teaching Economics Opens Student Application for Summer 2026
January 12, 2026 The Foundation for Teaching Economics is pleased to announce that applications for Summer 2026 student programs are…

Making Economics Meaningful for Students
The Fund for American Studies’ Liberty and Leadership podcast features FTE’s own Amanda Stiglbauer, a longtime member of our team who recently…
